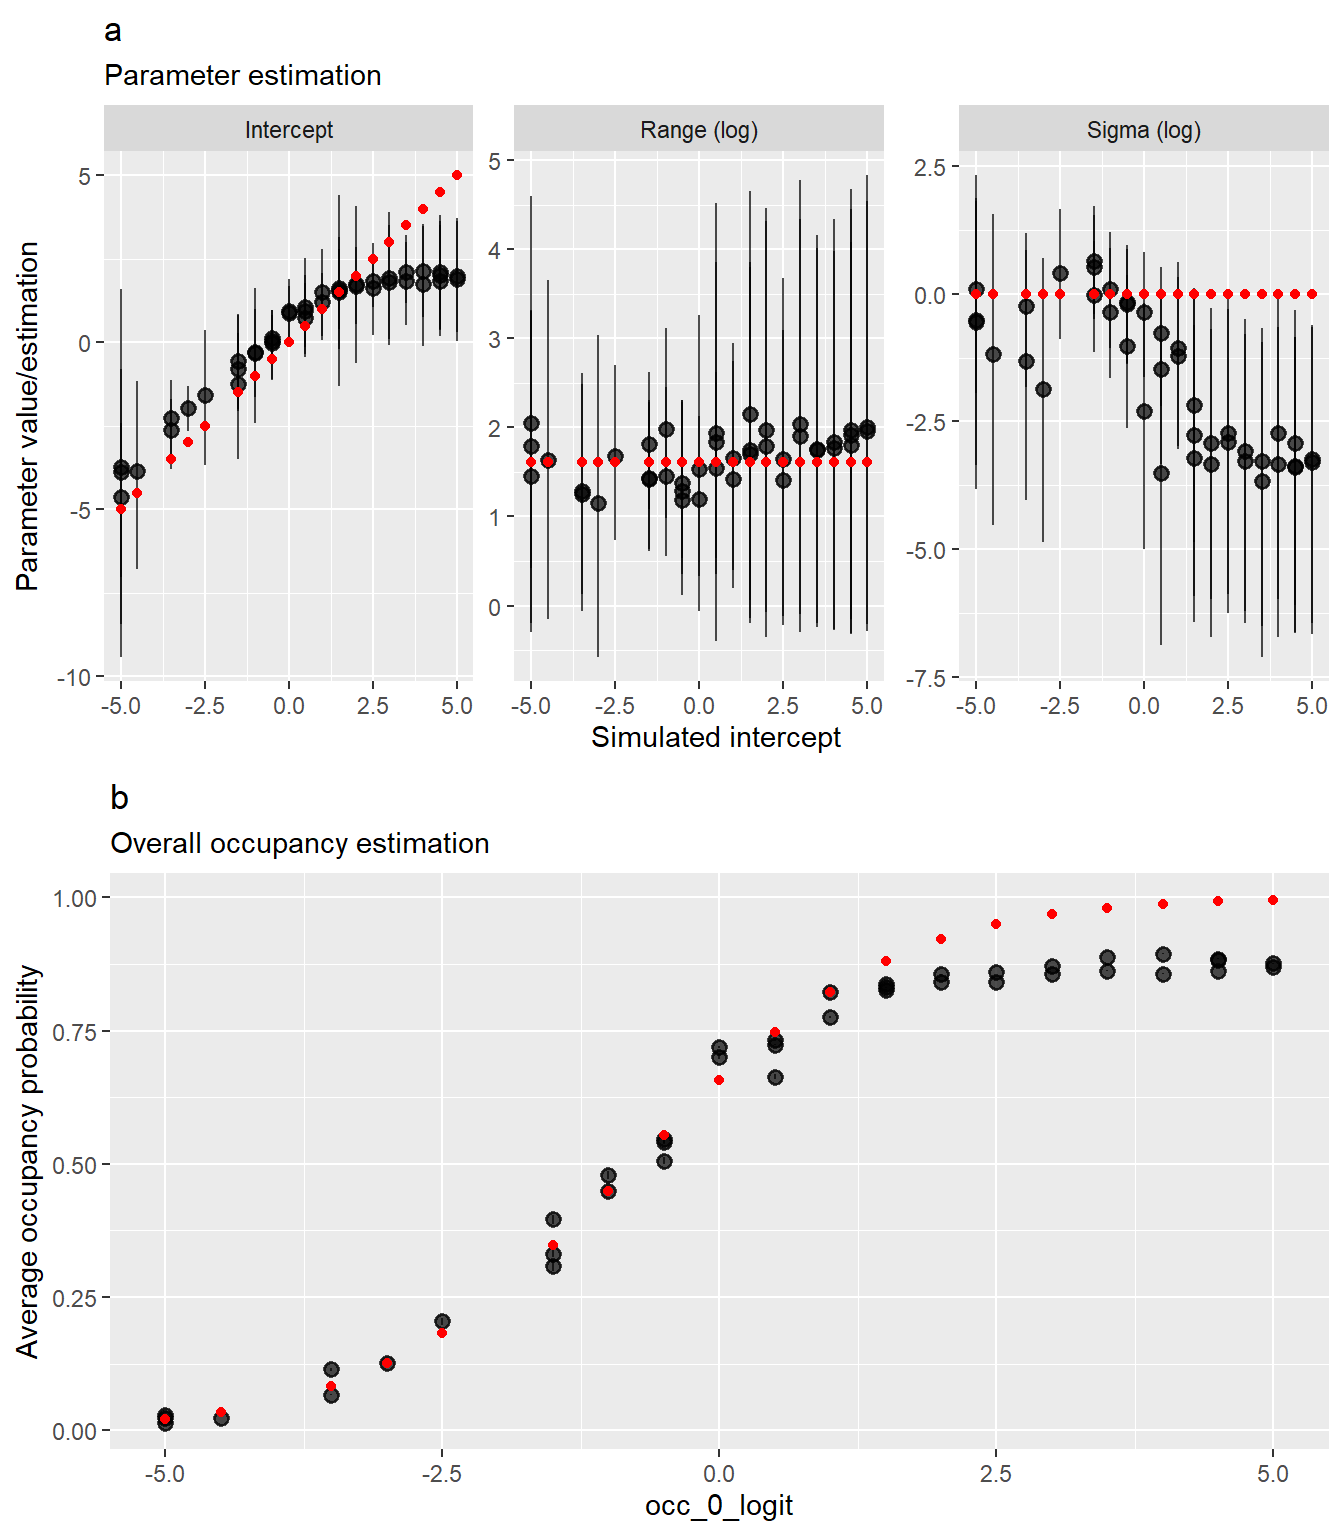
We have coded occupancy models using the very nice available tutorials and they have been working fine so far. However, when simulating datasets with a high occupancy probability we observe that INLA models gave completly wrong estimates of the intercept and other parameters associated with the spatial field. Below you will find a code allowing to reproduce that bug. This code simulates datasets with different intercepts and assess parameters’ estimation by INLA occupancy models.
The occupancy model
The occupancy model we will run here is a very simple model: a single year occupancy model with just a baseline detection probability in the observation model and an intercept + a spatial field in the state model.
Here, \(z_{i}\) denotes the occupancy state in site \(i\). \(\psi_{i}\) is the associated occupancy probability defined on the logit scale as a linear function of an intercept (\(\beta_0\)) and \(\omega\), a spatial Gaussian random field describing the spatial structure in the data.
The response \(y_{ij}\) is the detection/non-detection data for site \(i\) and visit \(j\), given \(z_{i}\). The detection probabilities \(p\) are defined on the logit scale as a linear function of \(\alpha_0\) (Intercept).
The problem
In our simulation scenario, we simulated a spatial field of occupancy (on the logit scale) and we varied the intercept on that logit scale (\(\beta_0\)). This is supposed to be a simple easy case of estimation for the model, because even if we have only one year, thus one realization of the Bernouilli processes, we sample all sites of the studied area, thus we do not unsampled areas. In most of the cases model estimations were ok. However, when increasing \(\beta_0\) above a given threshold (\(\beta_0 > 2\), which means \(\psi \approx 0.88\) ) then we observe that the model estimation degraded very quickly to become very bad.
               _
platform       x86_64-w64-mingw32
arch           x86_64
os             mingw32
crt            ucrt
system         x86_64, mingw32
status
major          4
minor          5.2
year           2025
month          10
day            31
svn rev        88974
language       R
version.string R version 4.5.2 (2025-10-31 ucrt)
nickname       [Not] Part in a Rumble
packageVersion("INLA")
[1] '26.9.17'
Simulating data
We first define an arbitrary spatial domain to simulate a spatial field representing variation in occupancy on the logit scale. Then we draw presences from that occupancy layer and detection and non-detection for each simulated visit. We then fitted the occupancy model using these detection and non-detection events only, to see the model could retrieve the simulated occupancy layer.
#Simulations parametersnc <-20#number of grid cells acros latitudenr <-20#number of grid cells acros longitude, 20*20 means 400 sitesnM <-51#maximal number of repeated visits, let's say 51 if we aggregate data at week levelocc_0_logit <-0#intercept of the modeldet_prob <-0.2#detection probabilitynrep_avg <-5#average number of repeated visits (1 repetition means 2 visits in a year per site)# Range and sigma0 define the spatial field:sigma0 <-1range0 <-5nrepli <-3#number of replicate per simulation scenario# Define spatial domainwin <-owin(c(0,10), c(0,10))Domain <-rast(nrows=nr, ncols=nc,xmax=win$xrange[2],xmin=win$xrange[1],ymax = win$yrange[2],ymin=win$yrange[1])values(Domain) <-1:ncell(Domain)names(Domain)="cell_id"# 1. Define a spatial domain and create a meshlocs <-crds(Domain) # 500 random points in a 10x10 squaremesh <-inla.mesh.2d(locs, max.edge =c(0.75, 2), cutoff =0.5)# 2. Build the SPDE model (Matérn covariance)spde <-inla.spde2.matern(mesh = mesh, alpha =2)# 3. Compute the precision matrix (Q) for the SPDE model# Kappa and tau can be derived from range0 and sigma0kappa0 <-sqrt(8) / range0tau0 <-1/ (sqrt(4* pi) * kappa0 * sigma0)Q <-inla.spde2.precision(spde, theta =c(log(tau0), log(kappa0)))spatial_field <-inla.qsample(n =1, Q = Q)spatial_values <-as.vector(spatial_field[mesh$idx$loc, ])#let's generate many different datasets with different interceptsdata_list=list()n <-0for(occ_0_logit inseq(-5,5,by=0.5)){for(j in1:nrepli){ n <- n+1#Now we can fit a model to that tab=as.data.frame(Domain,xy=TRUE) tab$field=spatial_values tab$occ_0_logit=occ_0_logit tab$occupancy_logit=occ_0_logit+spatial_values tab$occupancy=boot::inv.logit(tab$occupancy_logit) tab$presence=rbinom(size=1,n=nrow(tab),prob=tab$occupancy) tab$nrep=1+rnbinom(nrow(tab),mu=nrep_avg,size=5) tab$nrep[tab$nrep>=nM]=nM tab$repli=j det_tab=do.call("rbind",lapply(1:nrow(tab),function(x){do.call("rbind",replicate(tab$nrep[x], tab[x,],simplify=FALSE))})) det_tab$rown=1:nrow(det_tab) det_tab = det_tab %>% dplyr::group_by(cell_id) %>% dplyr::mutate(Visite =seq_along(nrep)) det_tab$detection=det_tab$presence*rbinom(nrow(det_tab),1,det_prob) matrix_spat=dcast(setDT(det_tab),cell_id+x+y+occupancy_logit+occupancy+presence+occ_0_logit+repli~paste0("W",Visite),value.var="detection") data_list[[n]]=matrix_spat }}
Fitting the model
Now let’s fit the model for each of the simulated dataset, with different intercepts:
mesh_diameter <-max(diff(range(mesh$loc[,1])), diff(range(mesh$loc[,2]))) r_0 <- mesh_diameter/3# Start with 1/3 of the total extentspde <-inla.spde2.pcmatern(mesh = mesh,prior.range =c(r_0,0.5),prior.sigma =c(1, 0.5)) #start with the good values# index set; "spatialfield" is the name used in the model formulaiset_sp <-inla.spde.make.index(name ="spatialfield", n.spde = spde$n.spde)model_list=list()for(n in1:length(data_list)){ matrix_spat=data_list[[n]]# projection matrix using the coordinates of the data and time index A_sp <-inla.spde.make.A(mesh = mesh,loc =as.matrix(matrix_spat[,c("x","y")]))#small mess to put detection covariates in the good format: Y_mat <- matrix_spat %>% dplyr::select(num_range("W",sort(unique(det_tab$Visite)))) %>%as.matrix() matrix_spat$intercept=1#detection covariates in the good format (only one intercept): matrix_spat$intercept=1 X_det <- matrix_spat[,rep("intercept",length(unique(det_tab$Visite))),with=FALSE] %>%as.matrix()#occupancy covariates X_cov <- matrix_spat %>% dplyr::select(c(cell_id)) stk <-inla.stack(data=list(Y = Y_mat, X = X_det),A=list(A_sp,1),effects=list(c(list(Int_occ=1), #the Intercept iset_sp), #the spatial index#the covariatesas.list(X_cov)),tag='spat') formula_spat <-inla.mdata(Y,X) ~-1+ Int_occ +f(spatialfield, model=spde) model_spat <-tryCatch({inla(formula_spat, data=inla.stack.data(stk),family='occupancy',control.predictor=list(A=inla.stack.A(stk),compute=TRUE),control.family =list(control.link =list(model ="logit"),link.simple ="logit"),control.compute=list(config =TRUE,waic=TRUE,cpo=TRUE,dic=TRUE,residuals=TRUE,mlik=TRUE))},error=function(x){return(NA)})if(class(model_spat)=="inla"){ model_list[[n]]=model_spat }}
Assessing the fit
Now we can compare the simulated and model’s estimation for the parameters that defined occupancy (the intercept and the spatial field parameters):
pred_list=list()est_list=list()for(n in1:length(model_list)){ model_spat=model_list[[n]] matrix_spat=data_list[[n]] occ_0_logit=unique(matrix_spat$occ_0_logit) repli=unique(matrix_spat$repli)if(!is.null(model_spat)){ field.result <-inla.spde2.result(inla = model_spat, # Your fitted inla objectname ="spatialfield", # Name of the SPDE spatial field component in your formulaspde = spde, # The spde object used in the modeldo.transf =TRUE# Transform parameters back to nominal scale ) est_fit=rbind(as.data.frame(model_spat$summary.fixed),field.result$summary.log.range.nominal[,-1],field.result$summary.log.variance.nominal[,-1]) est_fit$variable=row.names(est_fit) est_fit$true_val=c(occ_0_logit,log(range0),log(sigma0))names(est_fit)[3:5]=c("lwr","median","upr") est_fit$occ_0_logit=occ_0_logit est_fit$repli=repli samples_spat =inla.posterior.sample(100, model_spat) post_val=do.call(cbind,lapply(samples_spat,function(X) X$latent[startsWith(rownames(X$latent), "APred")]))## gather predictions together pred_df=matrix_spat %>% dplyr::select(c(names(X_cov),x,y,occupancy,occ_0_logit,occupancy_logit,presence,repli)) pred_df$occupancy_est <-apply(post_val,1,mean) pred_df$sde <-apply(post_val,1,sd) pred_df$lwr <-apply(post_val,1,quantile,prob=0.025) pred_df$upr <-apply(post_val,1,quantile,prob=0.975) pred_list[[n]]=pred_df est_list[[n]]=est_fit }}pred_df=rbindlist(pred_list)est_df=rbindlist(est_list)
Plot the fit for the models that did not crash only (might be incomplete if many models crashed):